
Comet 90004788 C/2023 C2 (ATLAS) Observation Details
/90004788 C/2023 C2 (ATLAS).png)
C/2023 C2 (ATLAS) Daily Motion
90004788 C/2023 C2 (ATLAS) will become visible in May, 24. After being too close to the Sun to observe, it will reappear in the night sky. Starting from May, 24, 90004788 C/2023 C2 (ATLAS) can be seen again, providing a good opportunity for observation.
C/2023 C2 (ATLAS) Visibility on March 25
90004788 C/2023 C2 (ATLAS) is visible from sunset through most of the night
C/2023 C2 (ATLAS) Rise and Set Timetable
| Time | Elevation | |
Moon Rise, 29.9% illuminated  | 08:37 | 57° |
| C/2023 C2 (ATLAS) transit | 11:32 | 77° |
| Sunset | 17:22 | 29° |
| Civil sunset | 17:49 | 25° |
| Astrosession begin | 18:51 | 17° |
| C/2023 C2 (ATLAS) set | 22:00 | |
| Moon Set | 00:30 | -1° |
| C/2023 C2 (ATLAS) rise | 01:00 | |
| Astrosession end | 03:35 | 13° |
| Civil sunrise | 04:37 | 21° |
| Sunrise | 05:04 | 24° |
Track C/2023 C2 (ATLAS) Position Throughout the Night
← Wed, 25 March 2026 →
| Time | |
| Altitude | |
| Azimuth |
Shift the map to change the time and observe C/2023 C2 (ATLAS) changing position in the night sky.
C/2023 C2 (ATLAS) Description
C/2023 C2 (ATLAS), designated as 90004788 C/2023 C2 (ATLAS), is a Jupiter-family comet. At the moment, 90004788 C/2023 C2 (ATLAS) is 6.063 AU (907,071,729 km) from Earth, and it is located in the constellation Cassiopeia.Current position of C/2023 C2 (ATLAS) in Solar System
| Date | Wed, 25 March 2026 |
| Distance from Earth to C/2023 C2 (ATLAS) | 6.0768 AU (909,076,341km) |
| Elongation | 49° |
| Angular diameter | " |
| Magnitude | 18.7 |
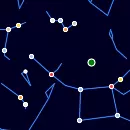
Finder Chart for C/2023 C2 (ATLAS)
Double-click to unlock the map.
| Object name | 90004788 C/2023 C2 (ATLAS) |
| Field of view | |
| Limiting magnitude | |
| 90004788 C/2023 C2 (ATLAS) coordinates | 0.54146, 50.33914 |
| Center coordinates | 0.54146, 50.33914 |
Annual motion of C/2023 C2 (ATLAS)
| Date | Wed, 25 March 2026 |
| Twighlight start | 18:46 |
| Twighlight end | 03:30 |
| Twighlight duration | 9h 44m |
| Rise | 01:00 |
| Set | 21:56 |
| Elevation at transit | 77° |
| Transit time | 11:28 |
| Equatorial coordinates | RA: 00h 33m 46s", Dec: 50° 24' 49s |
| Magnitude | 19 |
| Constellation | Cassiopeia |
The graph illustrates the annual visibility pattern of a C/2023 C2 (ATLAS), providing a comprehensive overview of its daily appearances and transit times throughout the year.
The graph is structured with the vertical axis showing the hours of the day, ranging from 12 AM to 12 AM the next day, while the horizontal axis spans each day of the year.
The reddish shaded area indicates the periods when the C/2023 C2 (ATLAS) is above the horizon, visible to observers. The white line marks the times when the celestial object reaches its highest point in the sky each day, known as the transit. You can also view detailed visibility information in a dedicated table, including exact rise, transit, and set times for each date.
Astrometric & Physical Parameters of 90004788 C/2023 C2 (ATLAS)
Coordinates & Visibility
| Right Ascension | 0.54146° |
| Declination | 50.33914° |
| Magnitude | 18.7 |
| Constellation | Cassiopeia |
| Elevation | 25.5° |
| Azimuth | -44.9° |
Acknowledgments
We acknowledge NASA's Jet Propulsion Laboratory (JPL) for providing essential data on asteroids and comets through their Small-Body Database (SBDB) and Center for Near-Earth Object Studies (CNEOS). Their continuous efforts in tracking and cataloging these celestial bodies make it possible to offer accurate and up-to-date information on their positions, orbits, and physical characteristics.